Hello! About four years ago, I started tracking every game I beat – and I mean really tracking. Through an excel file, I’ve been tracking the date I beat a game (rolled credits), what platform it was on, developer, publisher, how much money I spent, metacritic score, etc. Then, i used Tableau, which has a free online version, to run an analysis on the dataset. In total, there are about 170 games which has led to some interesting analysis. As a note, there are games that don’t technically have an ending so I didn’t include them (Fortnite, Apex Legends, Skater XL, Session, Rocket League). I’ll think of a way to incorporate this data in the future.
Let’s get into it!
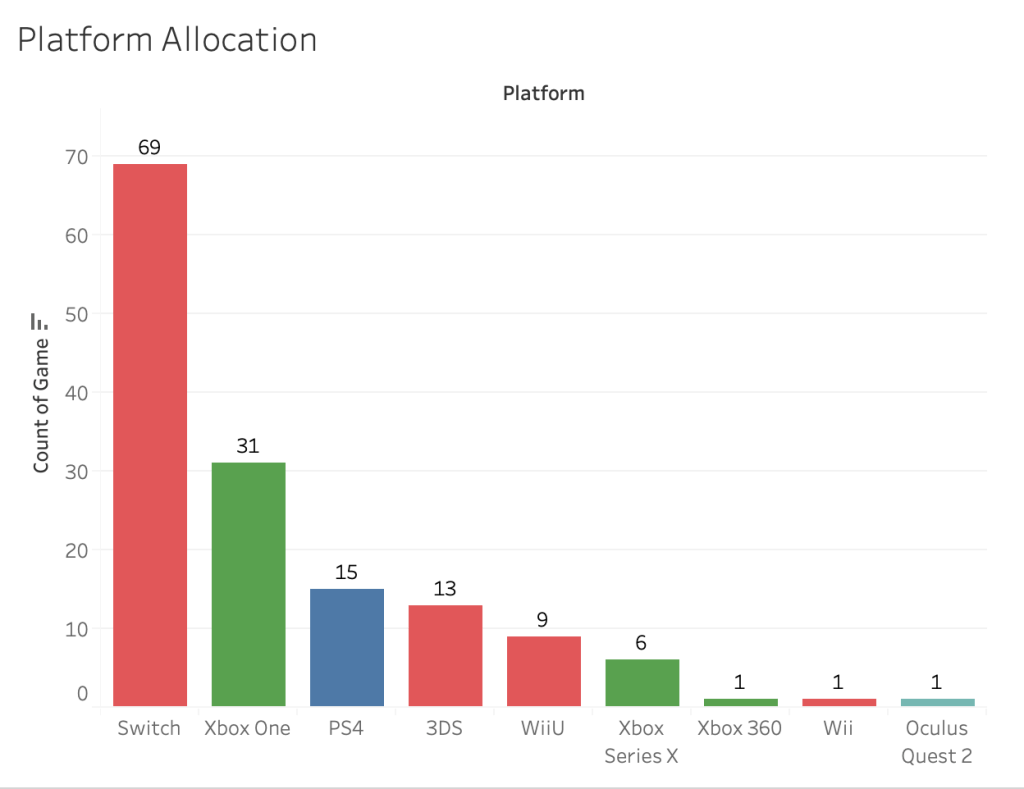
I’ll start with the most popular platform, the Nintendo Switch. At a staggering 69 games, i’ve beaten double the amount of games on the Switch than I have on the Xbox One, which I purchased three years prior to owning the Switch. The ability to play games docked or handled really appealed to me. I would say I play docked 40% and handheld 60% of the time. Currently, I am playing through Monster Hunter Rise in the Switch and Outriders on the Series X.
The listing trickles down from there, decreasing from 15 games on the PS4 (mainly first party) all the way down to 1 on the Oculus Quest 2 (Beat Saber). Speaking of Oculus, I need some game recommendations. Currently playing through The Walking Dead and enjoying it quite a bit. The 3DS, Wii, and Xbox 360 feel underrepresented here, since these consoles were released way before 2014. If anything, I would eventually track back to 2011 when the 3DS released to capture that data.

This is a look at most popular publishers. Nintendo leads the way by a large margin, followed by Sony and Capcom (Resident Evil / Monster Hunter). It drops off from there, but I realize I don’t typically shy away too much from my top 5 publishers (Nintendo, Sony, Capcom, Microsoft, Bethesda). Shout out to Devolver Digital, who has a phenomenal selection of games (Carrion, My Name is Pedro).

Most popular developers. As you can see, I have a soft spot for Naughty Dog and From Software. Also, shoutout to Intelligent Systems (Fire Emblem series), Platinum Games (Bayonetta, Astral Chain), Arkane Studios (Dishonored, Prey), and Red Barrels (Outlast).
I feel this listing gives a more diverse look in comparison with the list of publishers, which is pretty bland overall.

Box-and-whisker plot showing metacritic score by platform. Based off the games i’ve played, PS4 has the highest average, with the Nintendo Switch having the peak (Zelda: Breath of the Wild) and low point (Shaq-Fu). Yes, I played Shaq-Fu, but it was free okay? Regarding the PS4, I am more likely to only play critically acclaimed games there (God of War, Last of Us Part II, Uncharted 4) since it is not my go-to console.
Another note, is it seems i’m more likely to play games with a lower metacritic score on the Switch. I’m assuming it’s because these games are indies, have a lower price, and the risk of buyers remorse is much lower. Coincidentally, my backlog of games on the Switch are MUCH higher than anywhere else. I’m looking at you Octopath Traveler…and Hades…and Hyrule Warriors: Age of Calamity. One day.

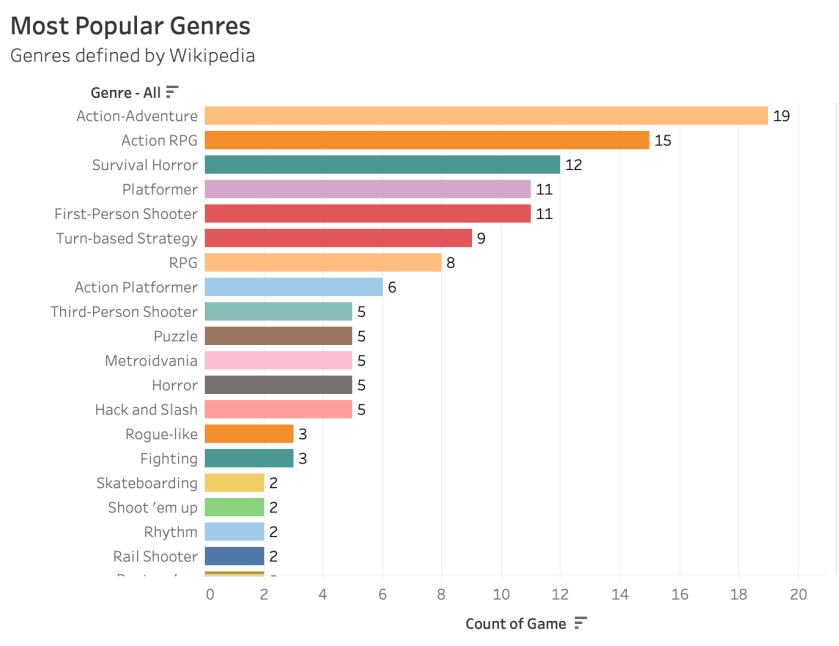
Here is a look at my top genres. Action games take the lead, split between Action-Adventure and Action RPG. For as long as I remember, I’ve been such a fan of this genre. I believe it all started with Zelda: Link’s Awakening on the GBC.
Survival Horror is next (Resident Evil, Evil Within, Alien Isolation) and Platformers follow behind. I’d like to think I’m more fearless with survival horror games than I actually am, but I do prefer having someone in the room while I’m playing. I love the fact that my partner gets more scared than I do, even though I’m the one in control of what happens. Regarding platformers, who’s NOT a fan of that genre? Please let me know in the comments if you’re not, I’d like to hear why!
If it was my choice, Skateboarding games would be at the top of my list. I wanted to add Session and Skater XL to this list, but technically you can’t roll credits for those.
Also, props to myself for finishing 3 rogue-likes. Slay the Spire and Dead Cells are absolute top-tier rogue-likes. I’m still making my way through Hades, and am open to other rogue-like suggestions!

Here is a look at total games beat per year. There was a peak in 2017, likely due to the release of the Nintendo Switch. I picked up everything from Zelda: Breath of the Wild to Snake Pass, and was loving every minute of it. For me, 2017 was one of my favorite years in gaming. From Zelda: Breath of the Wild to Splatoon 2 to Mario Odyssey, Nintendo fans had a ton to look forward to. Also, we saw the release of Resident Evil 7, and I was able to play through using PSVR. That was one of the coolest gaming experiences I’ve had to date.
There was a slight dip in 2018, which I attribute to grad school and CPA exams taking up some time. I am a licensed CPA now! Definitely worth it.
Then, obviously there is a second peak in 2020 due to the COVID-19 pandemic (and game pass). While 2020 was a tumultuous year, it was a great year for gaming. I played games like Final Fantasy XV, The Witcher 3, and Control, which I may not have played otherwise.

Here’s a look at most popular months for finishing games. This represents total games beat, not an average. The dip between May – August is due to a mix of the usual slow-down of game releases during the summer, as well as myself partaking in more outdoor activities / travel. The peak in January is the after-Christmas bump, when I typically have some time off to play more games and relax.

Days of the week. Interesting hump-day peak, which I can’t really explain. Slight decrease on Fridays since I’m normally doing activities with my partner or friends on Friday nights, and another dip on Mondays because…it’s Monday of course. Overall, not a strong correlation here but interesting nonetheless.

Total spend per platform. Was unsure of adding this one, but wanted to be totally transparent with this data. Gaming is certainly an expensive hobby. I would like to note that the very low number for the Series X is driven by GamePass and Game Sharing. Additionally, this represents money spent on games Ive finished, not every game I have purchased. I’m not sure if I want to do THAT analysis.
That’s it for now! I’m still thinking of ways to add to the data-set. I’ve thought of adding my time played for each title, but that might take a lot of additional work. Let me know your thoughts and if there is anything you would like to see!
